Best Elementary Schools in San Mateo County, California
Part of our Best Schools in San Mateo County guide.
Introduction
San Mateo County sits in one of the most educationally competitive regions in the country, and the elementary schools here reflect that. Nestled between San Francisco and Silicon Valley, the county draws families who prioritize academics — and the schools have risen to meet that demand. From the tree-lined streets of Hillsborough to the tight-knit communities of San Carlos and Belmont, you'll find some of California's highest-performing elementary schools concentrated in a relatively small geographic area.
If you're a parent trying to figure out where to put down roots in the Bay Area, the school options here can feel overwhelming. This list is meant to cut through the noise and highlight the ten elementary schools that rose to the top based on real student performance data. Whether you're drawn to a particular city or just want to know where the academic bar is highest, these are the schools worth knowing about.
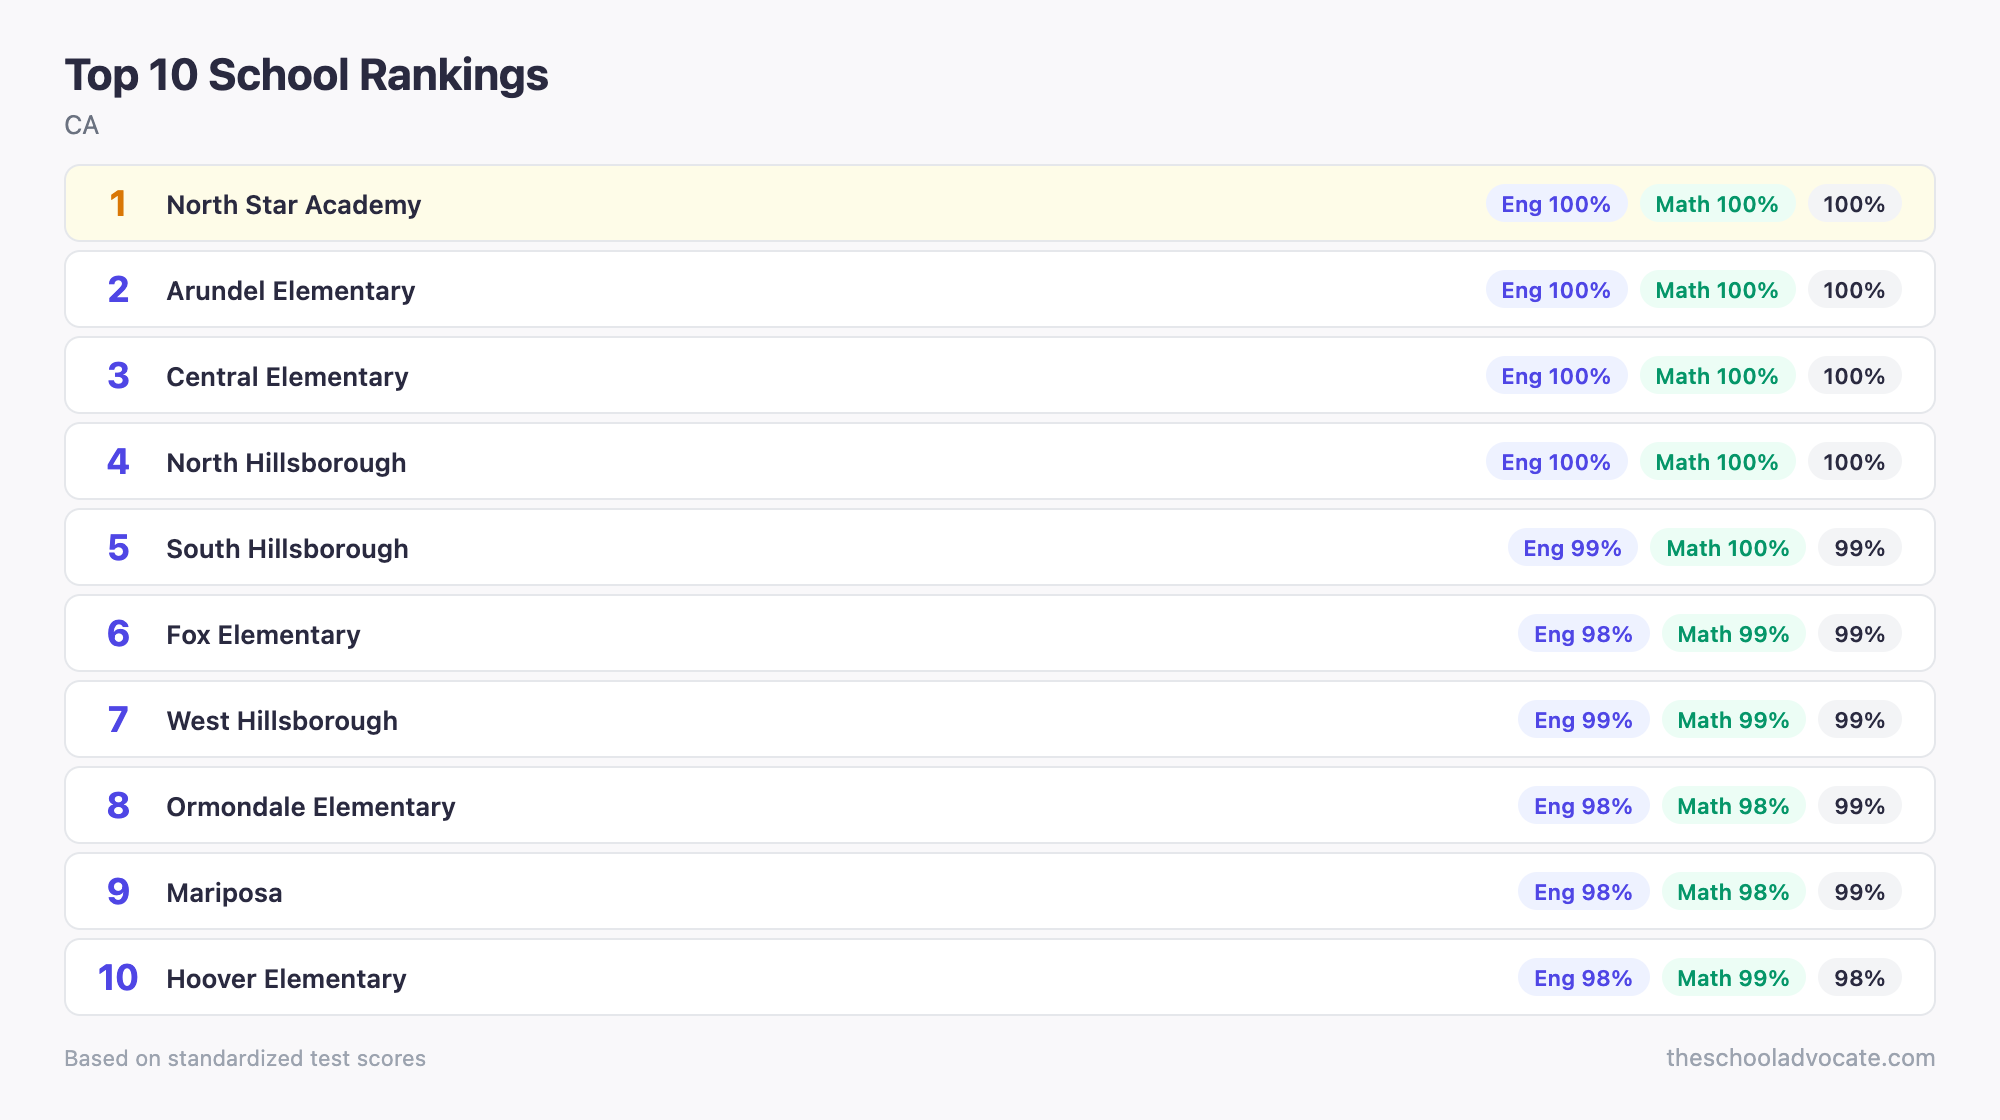
1. North Star Academy — Redwood City Elementary, Redwood City
North Star Academy is about as close to a perfect score as a school can get, ranking at the 100th percentile in English, Math, and Science — a sweep that puts it in genuinely rare company statewide. Located in Redwood City, a city that has transformed significantly over the past decade into a vibrant, family-friendly hub with a buzzing downtown and relatively more accessible home prices than neighboring Menlo Park or Palo Alto. Families who are academically driven but also want a community with some energy and diversity will find a lot to like here.
2. Arundel Elementary — San Carlos Elementary, San Carlos
San Carlos has long had a reputation as one of the most livable small cities on the Peninsula — locals call it "The City of Good Living," and the schools are a big reason why. Arundel Elementary ranks at the 100th percentile in both English and Math, making it one of the top-performing schools not just in the county but in the state. It's the kind of school that draws families who are deeply invested in their kids' education and want to be part of a close, engaged school community in a walkable, suburban setting.
3. Central Elementary — Belmont-Redwood Shores Elementary, Belmont

Central Elementary in Belmont hits the 100th percentile across the board — English, Math, and Science — which is a remarkable achievement for any public school. Belmont itself is a quiet, hillside community that often flies under the radar compared to flashier Peninsula towns, but families who discover it tend to stay. The school appeals to parents who want exceptional academics without the intense pressure-cooker atmosphere that can sometimes accompany Silicon Valley's most high-profile school districts.
4. North Hillsborough — Hillsborough City Elementary, Hillsborough
Hillsborough is one of the wealthiest municipalities in California, and its schools are consistently among the strongest in the state — North Hillsborough is no exception, ranking at the 100th percentile in English and Math, and the 99th in Science. The Hillsborough City Elementary District is small and well-resourced, with deep parent involvement and a community that takes education seriously. If you're considering Hillsborough, know that you're looking at some of the most competitive real estate on the Peninsula — but the schools are a significant part of what families are paying for.
5. South Hillsborough — Hillsborough City Elementary, Hillsborough
South Hillsborough rounds out the Hillsborough trifecta near the top of this list, ranking at the 99th percentile overall with scores of 99th in English, 100th in Math, and 96th in Science. Like its sibling schools in the district, South Hillsborough benefits from the resources and parent engagement that define Hillsborough as a whole. Families relocating to the area who land in the South Hillsborough attendance zone can feel confident they're in excellent hands academically.
Score Trends — Top 5
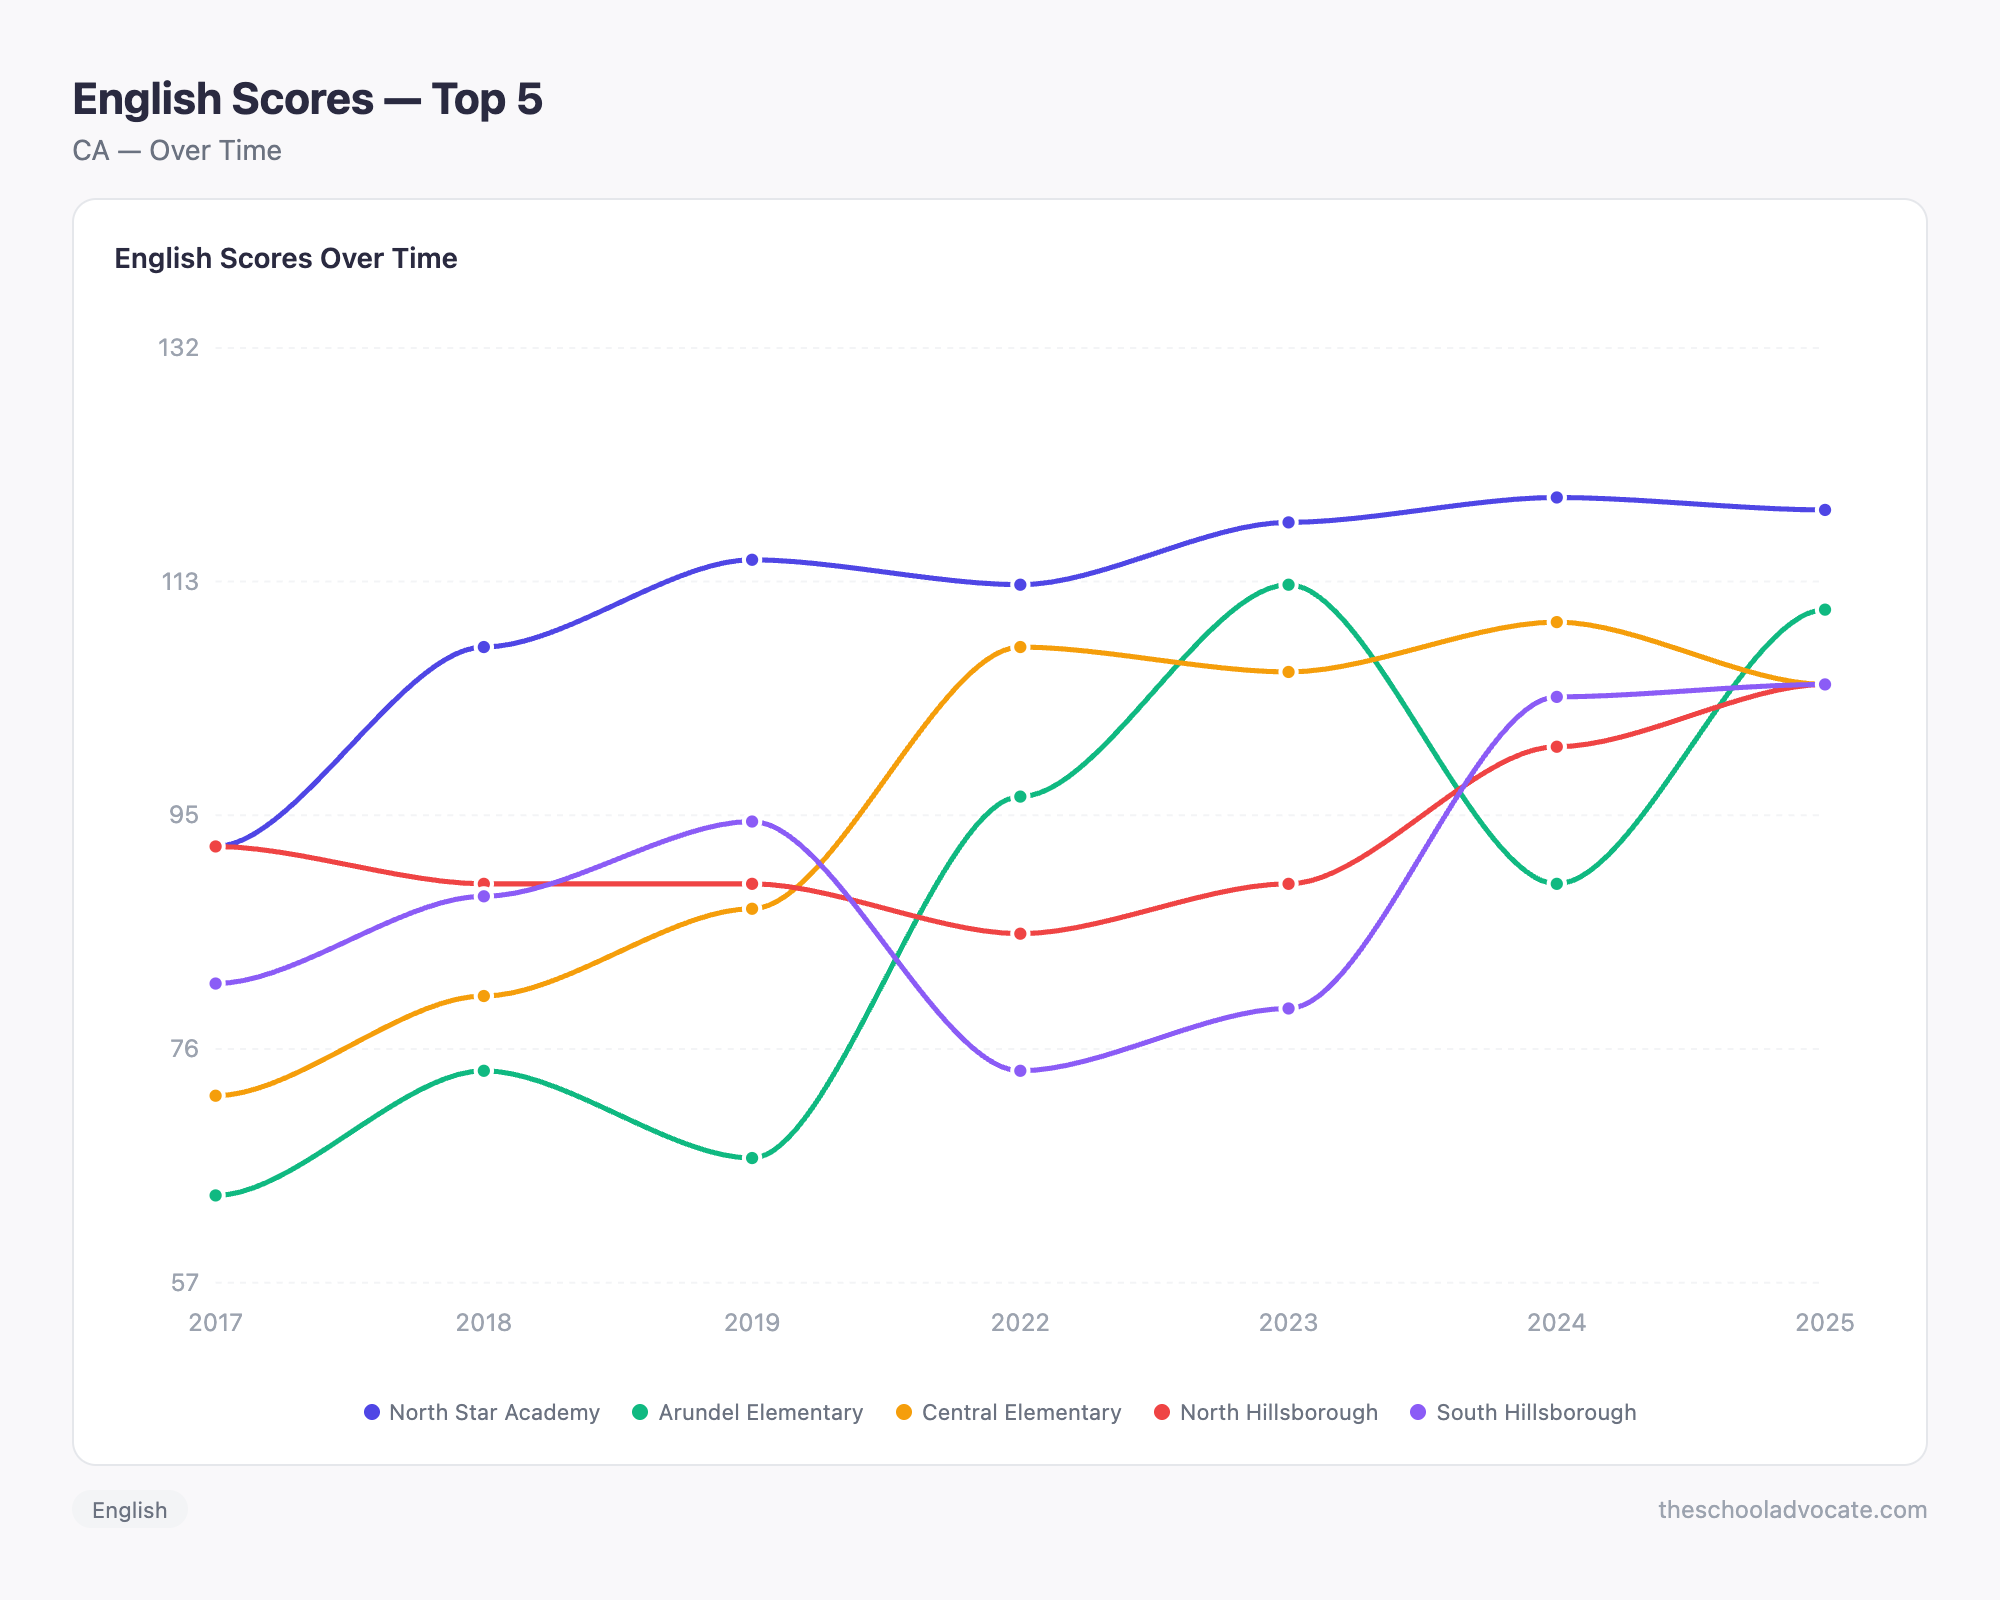
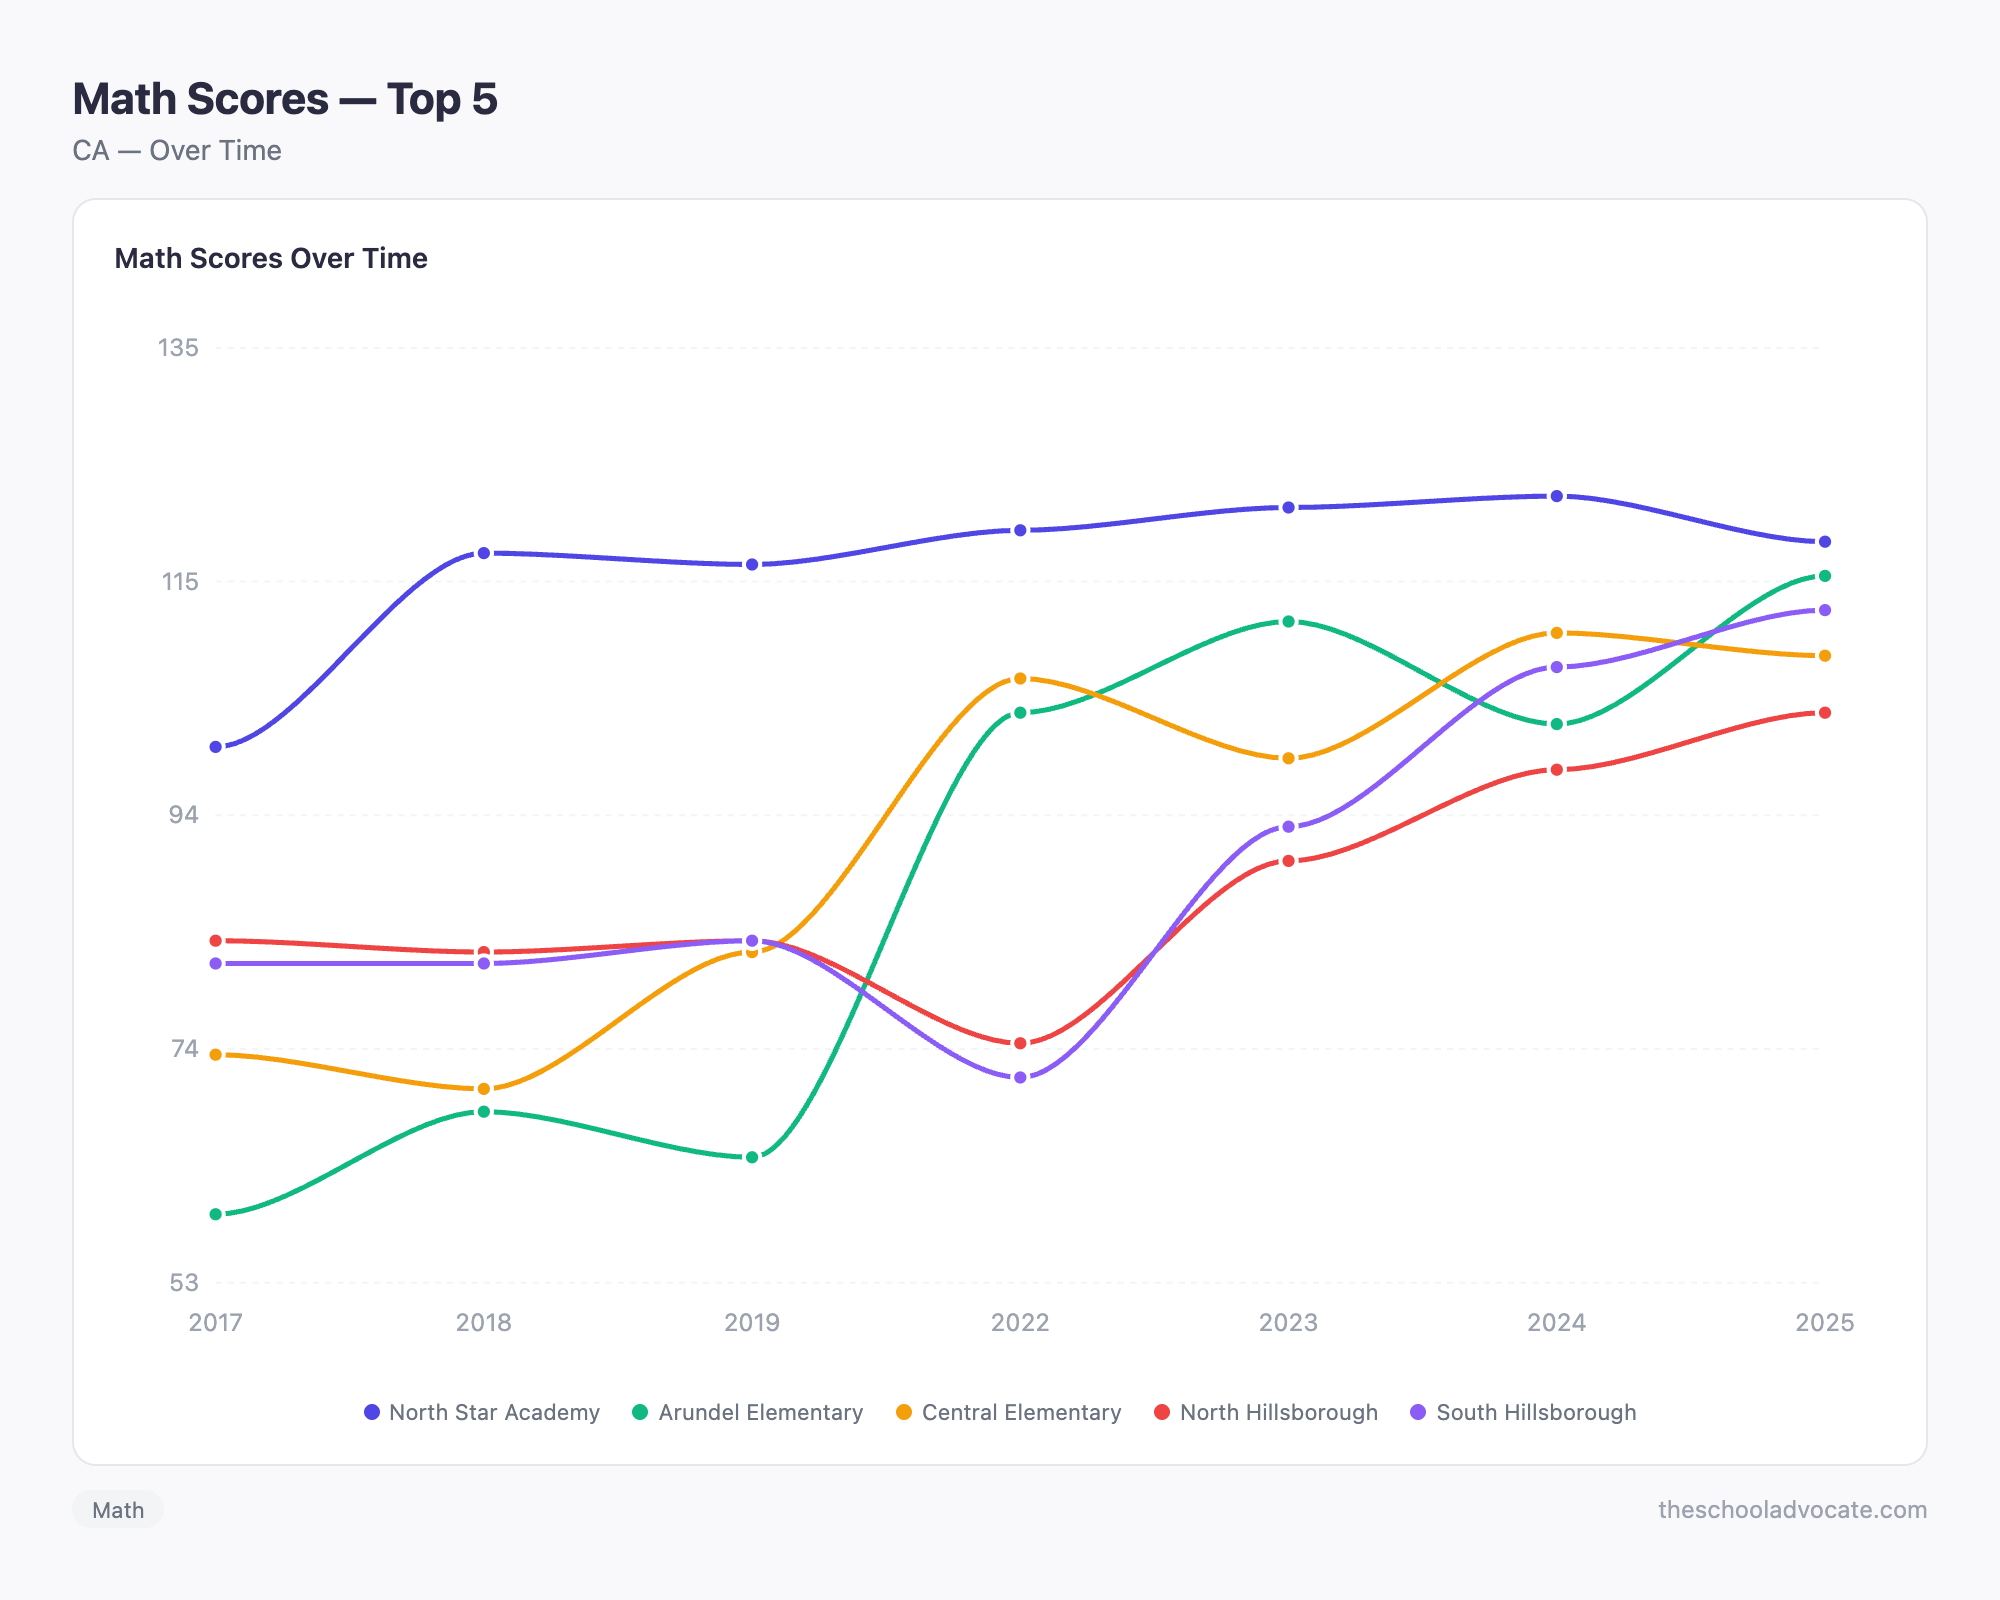
North Star Academy remains a strong performer but showed slight slippage this year, with English scores dipping just one point to 119 and Math dropping four points to 118—their first decline in both subjects. Arundel Elementary, on the other hand, is the star performer of this group, posting impressive gains in both subjects with English jumping 22 points (from 89 to 111) and Math rising 13 points (from 102 to 115), making it a school to watch. Central Elementary experienced modest declines across the board, dropping five points in English (now at 105) and two points in Math (now at 108), suggesting they may need to reassess their instructional strategies. North Hillsborough turned in a solid, consistent performance with English climbing five points to 105 and Math also gaining five points to 103, showing balanced improvement in both subjects. South Hillsborough proved steady and reliable, with English essentially flat at 105 and Math growing five points to 112, demonstrating that stability paired with Math gains can still move a school forward.
6. Fox Elementary — Belmont-Redwood Shores Elementary, Belmont
Fox Elementary is the second Belmont-Redwood Shores school to crack this list, ranking at the 99th percentile overall with a standout 100th percentile score in Science. That Science result is particularly notable — it's one of the strongest science scores in the entire county and reflects a school that clearly invests in STEM learning. Families who want their kids to develop strong analytical and scientific thinking from an early age will find Fox Elementary an especially compelling option within the Belmont area.
7. West Hillsborough — Hillsborough City Elementary, Hillsborough
West Hillsborough completes a remarkable showing for the Hillsborough City Elementary District, with all three of its schools appearing in the county's top ten. West Hillsborough ranks at the 99th percentile overall, with 99th percentile scores in both English and Math and 97th in Science. The consistency across all three Hillsborough schools speaks to a district-wide culture of academic excellence rather than the success of any single program or principal — and that kind of institutional strength is exactly what families want to see when choosing a school.
8. Ormondale Elementary — Portola Valley Elementary, Portola Valley
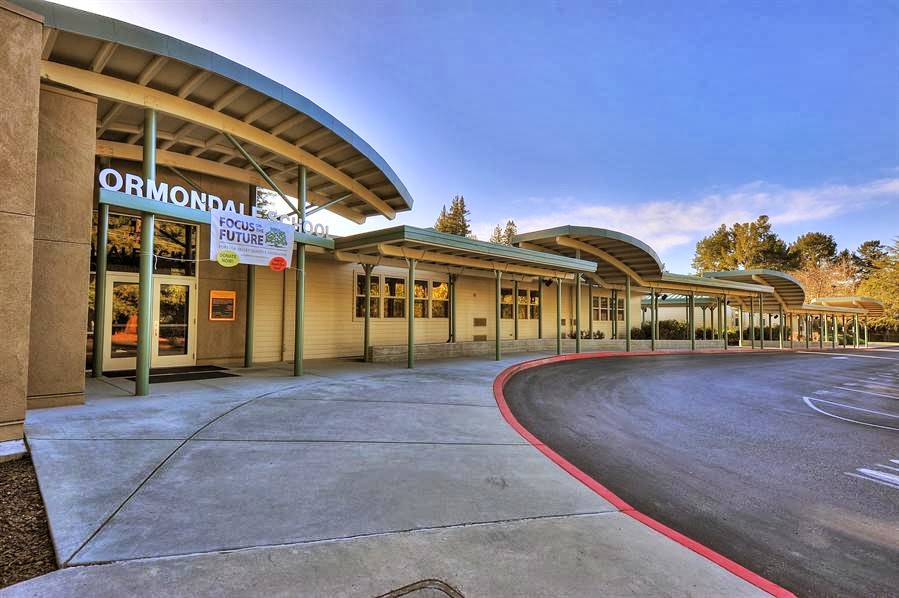
Portola Valley is one of those places that Bay Area locals seem to keep as a quiet secret — a beautiful, semi-rural community tucked into the hills above Palo Alto, with a small-town feel that's rare this close to Silicon Valley. Ormondale Elementary ranks at the 99th percentile overall, with 98th percentile scores in both English and Math. The Portola Valley Elementary District is tiny by design, and that small scale means students tend to get a lot of individual attention in an environment that feels more like a community than a traditional school campus.
9. Mariposa — San Carlos Elementary, San Carlos
Mariposa gives San Carlos its second school in the top ten, reinforcing just how strong the San Carlos Elementary District is as a whole. Ranking at the 99th percentile overall — with 98th percentile scores in English and Math and 99th in Science — Mariposa is a school that performs across every subject area without a weak spot. San Carlos families often have the enviable problem of choosing between two excellent schools, and Mariposa's science scores in particular make it stand out for families with kids who love to ask "why" about everything.
10. Hoover Elementary — Burlingame Elementary, Burlingame
Burlingame is one of the most beloved communities on the Peninsula — a charming, walkable city with a thriving downtown, great restaurants, and a strong sense of neighborhood identity. Hoover Elementary fits right into that character, ranking at the 98th percentile overall with scores of 98th in English, 99th in Math, and 97th in Science. For families who want a high-performing school in a city with a genuine sense of place — not just a suburb that exists to serve commuters — Burlingame and Hoover Elementary deserve a serious look.
Score Trends — #6-10
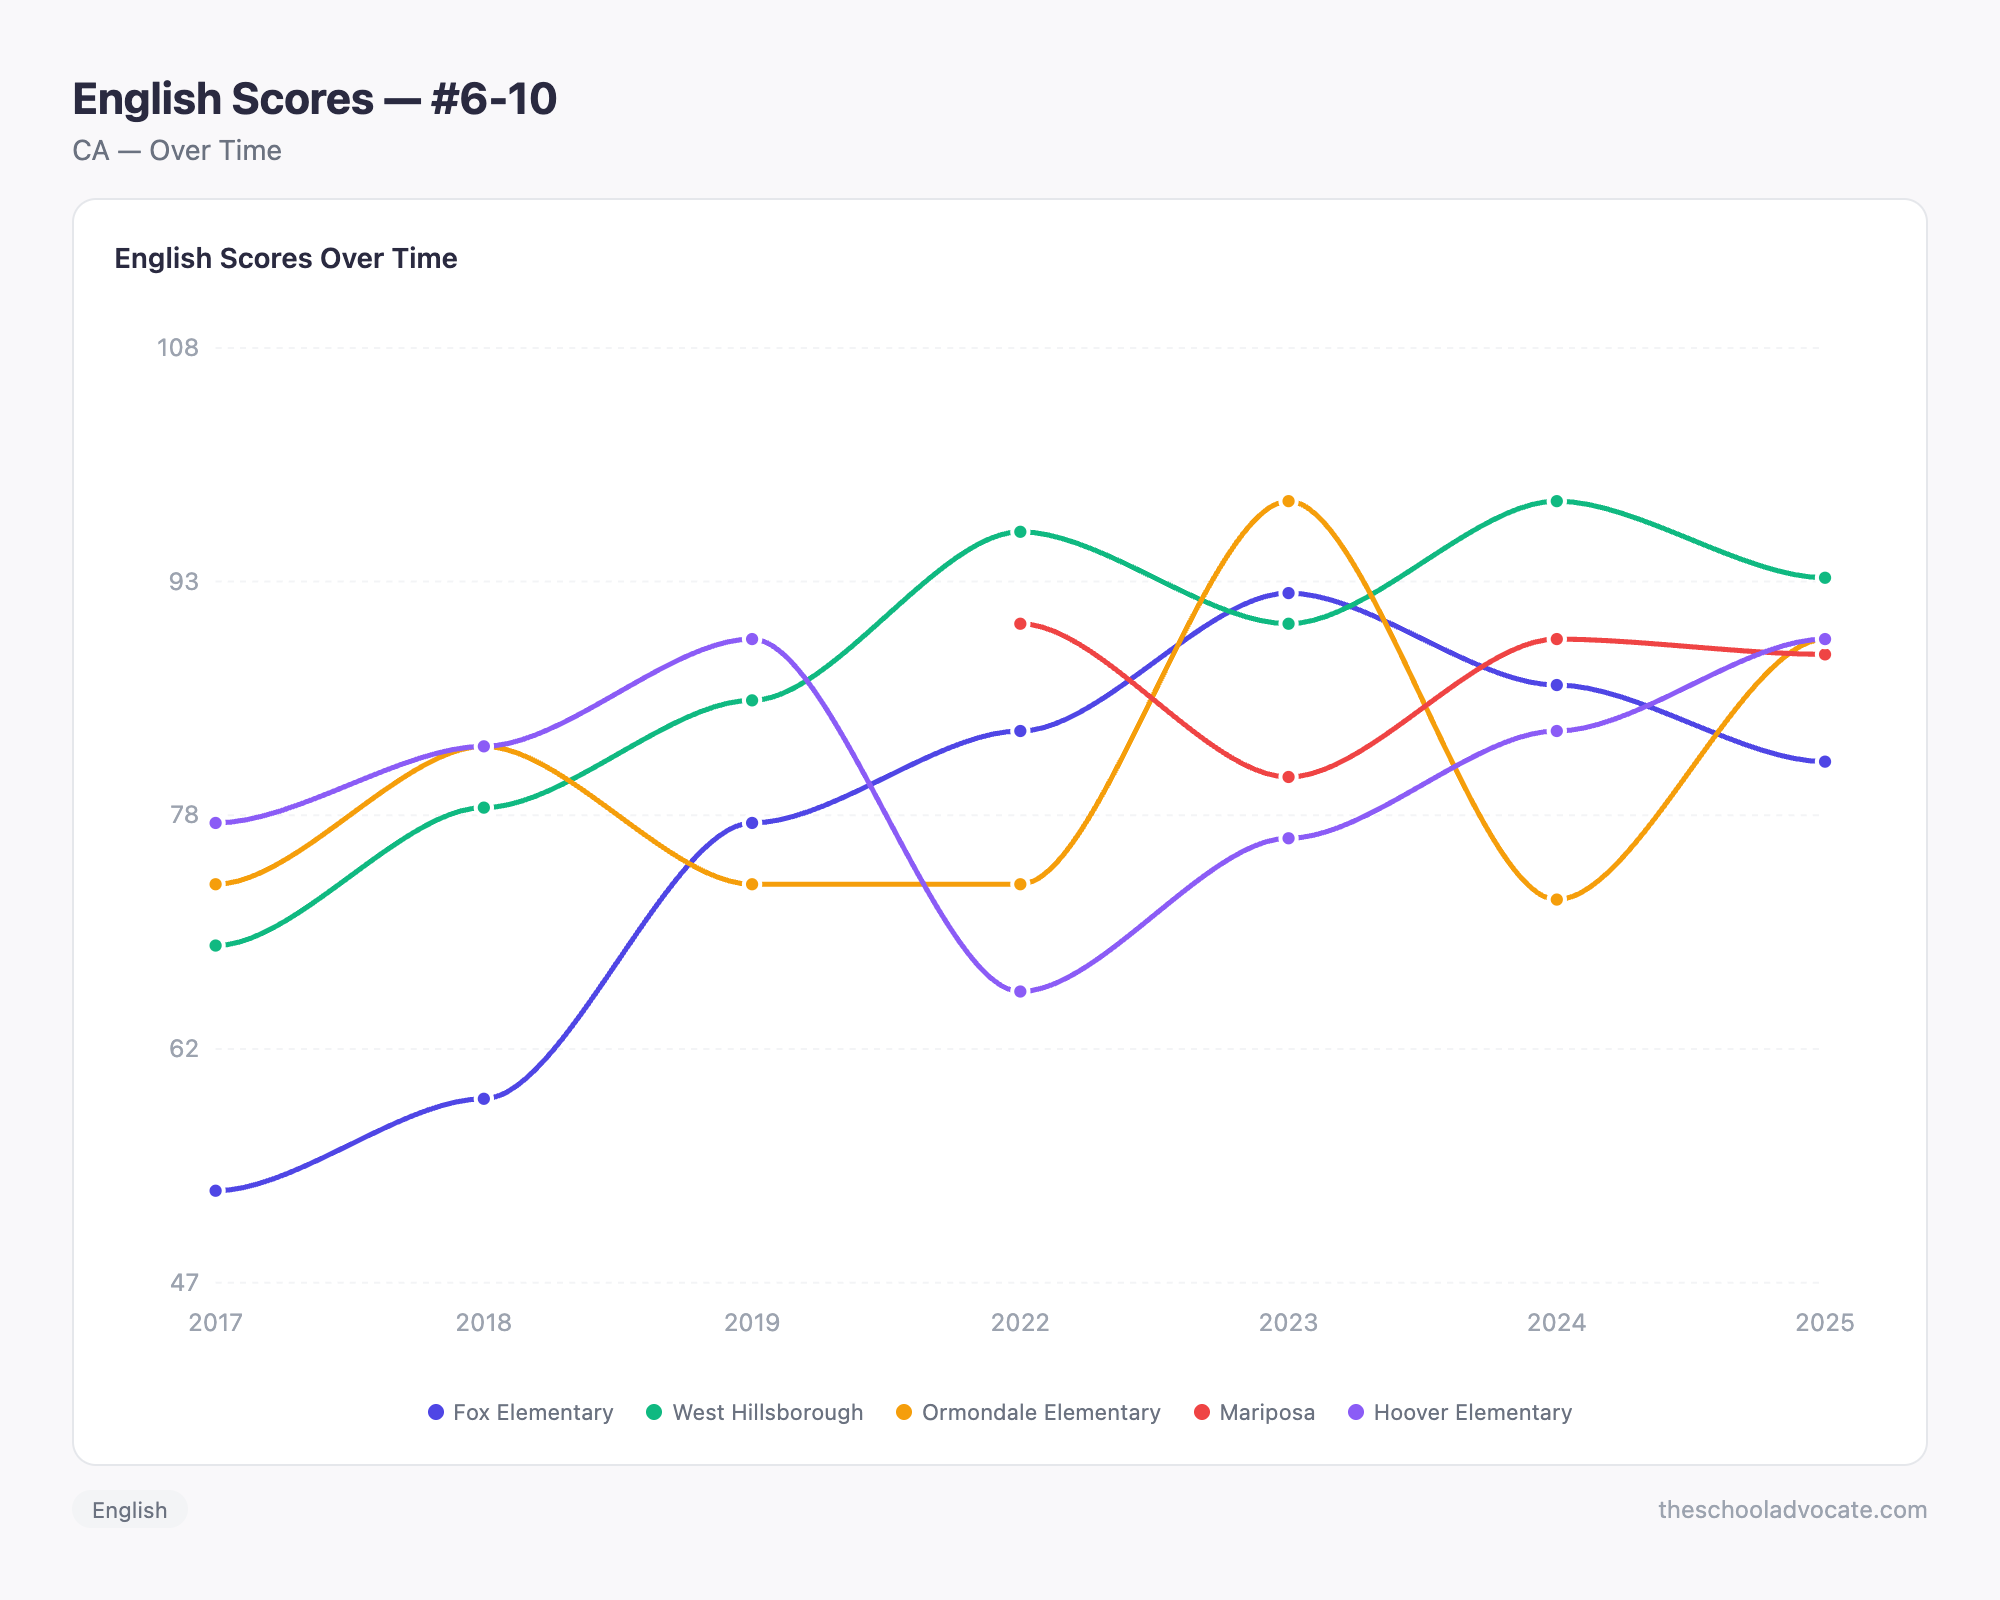
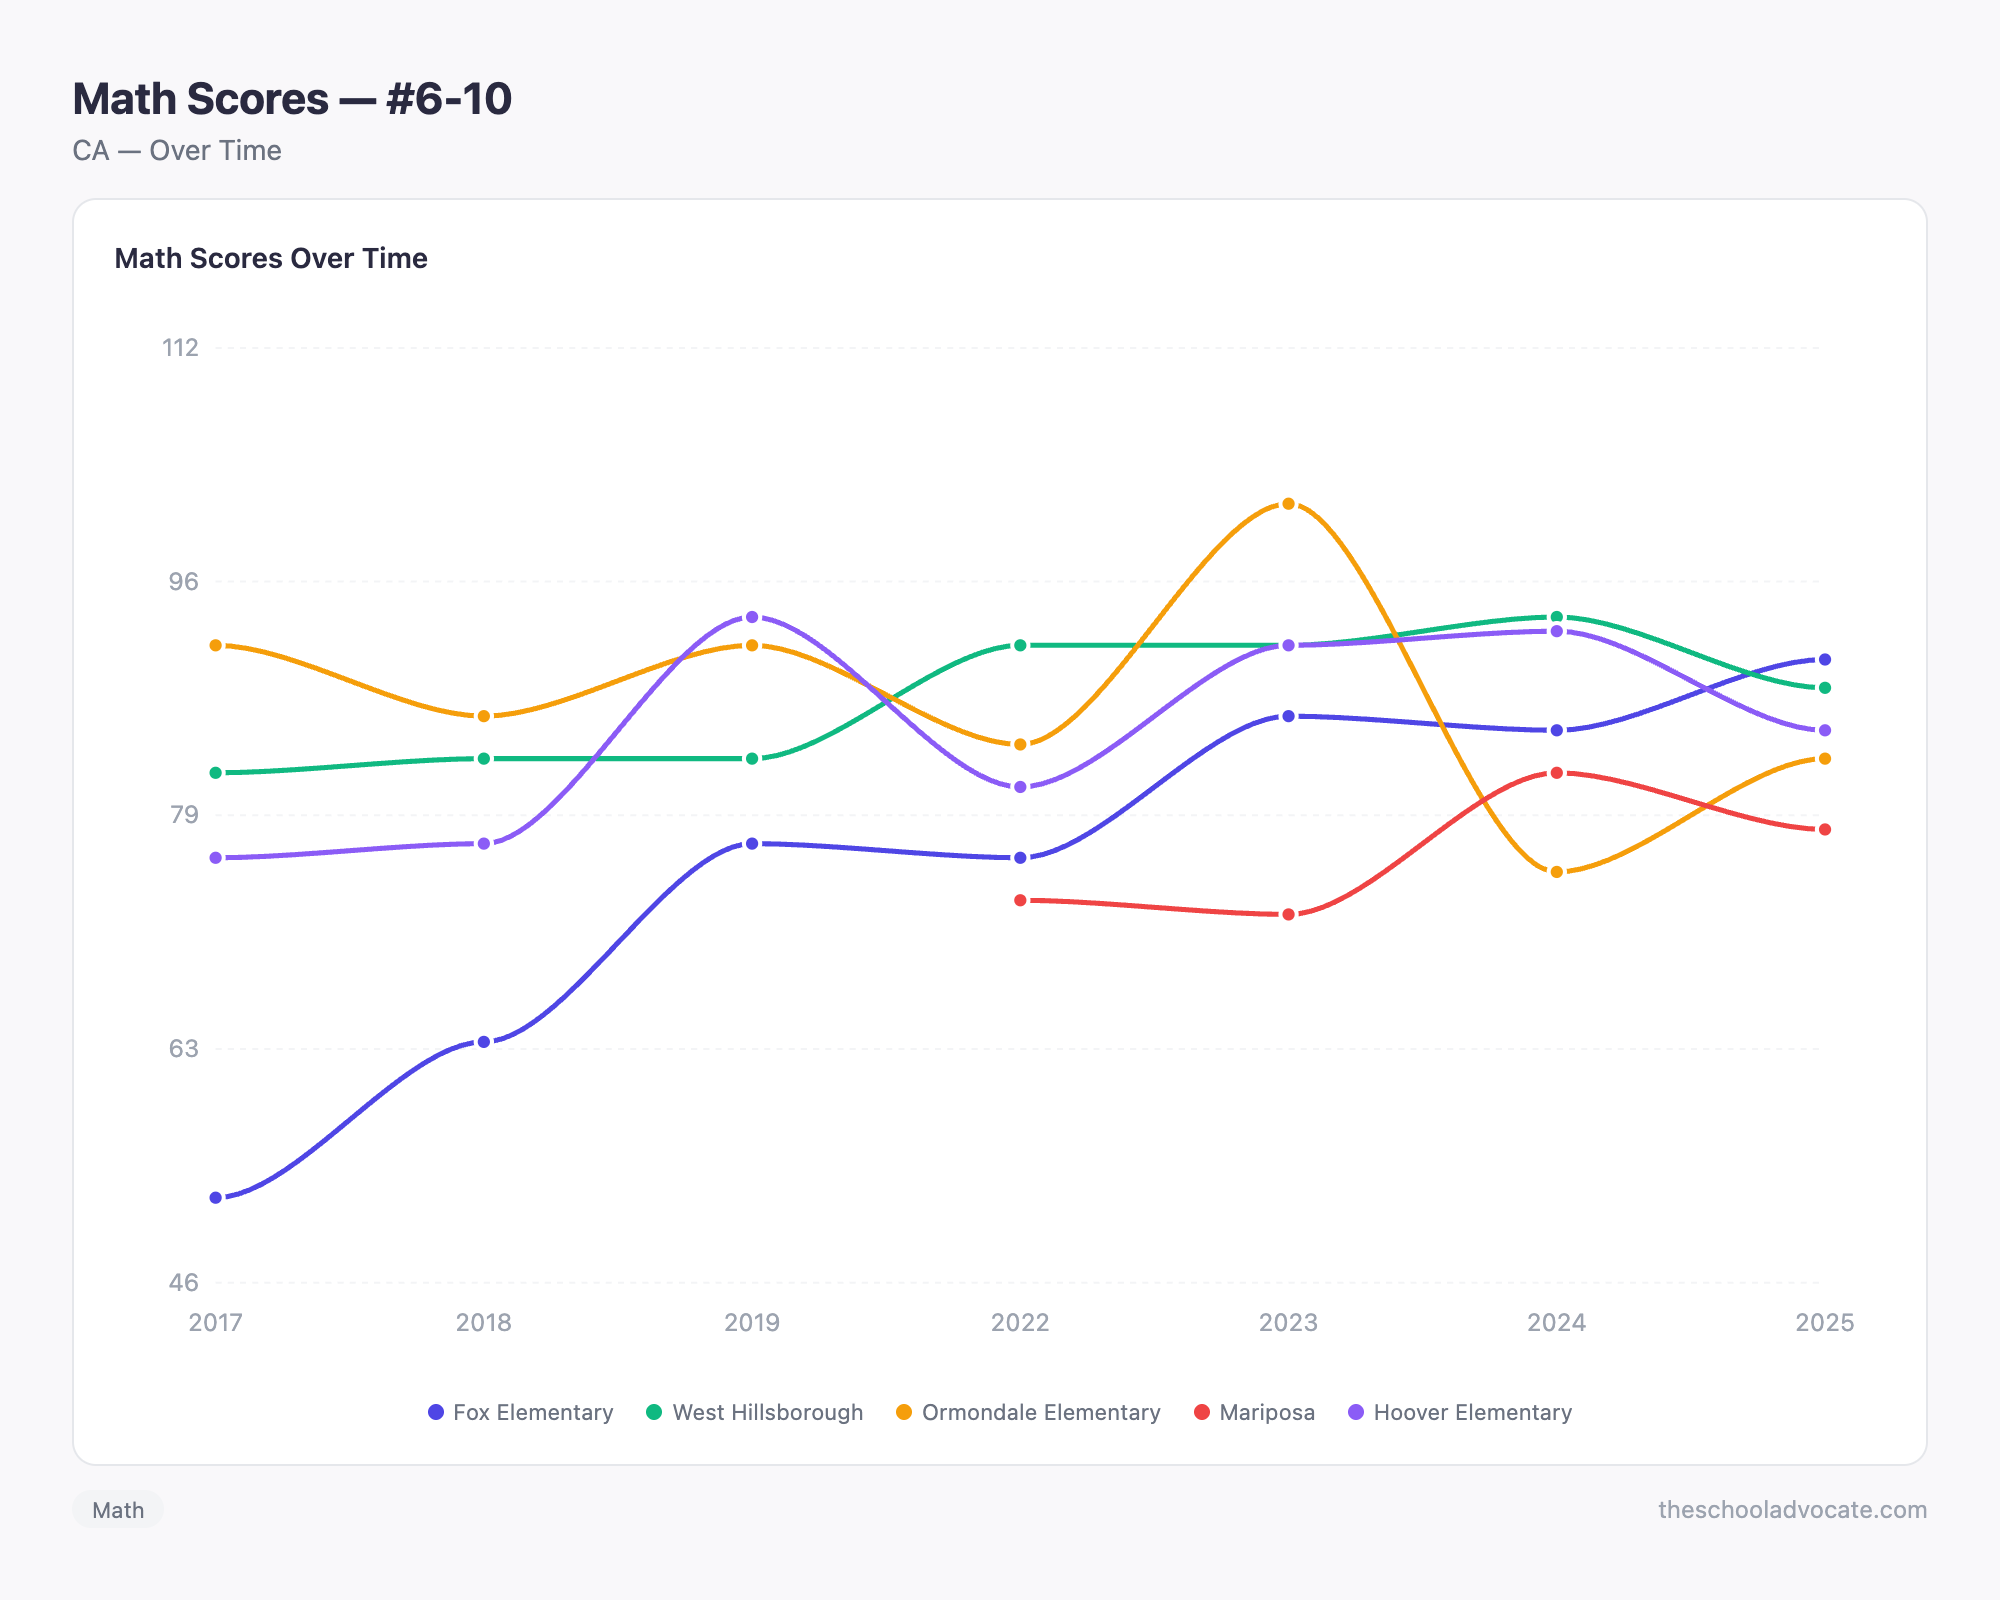
Fox Elementary presents a mixed picture—English dropped five points to 81, but Math bucked the trend with a five-point gain to 90, suggesting their focus on numeracy instruction is paying off. West Hillsborough struggled across both subjects this year, losing five points in English (down to 93) and another five in Math (down to 88), making it the lowest-performing school in this group. Ormondale Elementary showcases a remarkable turnaround, with English surging 17 points (from 72 to 89) and Math climbing eight points (from 75 to 83)—one of the district's most impressive improvements. Mariposa dipped slightly in both subjects, with English dropping one point to 88 and Math falling four points to 78, showing consistent but concerning downward momentum. Hoover Elementary finished on an uneven note, gaining six points in English to reach 89 but losing seven points in Math to drop to 85, indicating a need to strengthen their Math program while maintaining English momentum.
How We Rank Schools
The School Advocate ranks schools using a weighted combination of state assessment results across three subjects. English scores account for 40% of the overall ranking, Math accounts for another 40%, and Science makes up the remaining 20%. Within each subject, more recent test years are weighted more heavily than older ones, so the rankings reflect where a school is trending now rather than resting on historical results. Percentile scores represent how a school performs relative to all other public elementary schools in California.
Compare Schools Yourself
Numbers tell part of the story, but every family's priorities are different. If you want to dig deeper — stack two schools side by side, look at individual subject performance, or explore other schools in a specific district — head over to our school comparison tool at /compare. It's free, and it lets you build the kind of detailed picture that a ranked list alone can't give you.
Top 50 Rankings
| Rank | School | District | City | English | Math | Overall |
|---|---|---|---|---|---|---|
| 1 | North Star Academy | Redwood City Elementary | Redwood City | 100 | 100 | 100 |
| 2 | Arundel Elementary | San Carlos Elementary | San Carlos | 100 | 100 | 100 |
| 3 | Central Elementary | Belmont-Redwood Shores Elementary | Belmont | 100 | 100 | 100 |
| 4 | North Hillsborough | Hillsborough City Elementary | Hillsborough | 100 | 100 | 100 |
| 5 | South Hillsborough | Hillsborough City Elementary | Hillsborough | 99 | 100 | 99 |
| 6 | Fox Elementary | Belmont-Redwood Shores Elementary | Belmont | 98 | 99 | 99 |
| 7 | West Hillsborough | Hillsborough City Elementary | Hillsborough | 99 | 99 | 99 |
| 8 | Ormondale Elementary | Portola Valley Elementary | Portola Valley | 98 | 98 | 99 |
| 9 | Mariposa | San Carlos Elementary | San Carlos | 98 | 98 | 99 |
| 10 | Hoover Elementary | Burlingame Elementary | Burlingame | 98 | 99 | 98 |
| 11 | College Park Elementary | San Mateo-Foster City | San Mateo | 96 | 99 | 98 |
| 12 | Las Lomitas Elementary | Las Lomitas Elementary | Atherton | 96 | 99 | 98 |
| 13 | Franklin Elementary | Burlingame Elementary | Burlingame | 97 | 98 | 98 |
| 14 | Woodside Elementary | Woodside Elementary | Woodside | 99 | 97 | 98 |
| 15 | Oak Knoll Elementary | Menlo Park City Elementary | Menlo Park | 98 | 97 | 98 |
| 16 | Laurel Elementary | Menlo Park City Elementary | Atherton | 97 | 98 | 97 |
| 17 | Arroyo | San Carlos Elementary | San Carlos | 96 | 95 | 96 |
| 18 | Redwood Shores Elementary | Belmont-Redwood Shores Elementary | Redwood City | 93 | 97 | 96 |
| 19 | Lincoln Elementary | Burlingame Elementary | Burlingame | 96 | 96 | 95 |
| 20 | Cipriani Elementary | Belmont-Redwood Shores Elementary | Belmont | 93 | 95 | 95 |
| 21 | North Shoreview Montessori | San Mateo-Foster City | San Mateo | 94 | 93 | 95 |
| 22 | White Oaks Elementary | San Carlos Elementary | San Carlos | 91 | 97 | 94 |
| 23 | Monte Verde Elementary | South San Francisco Unified | San Bruno | 94 | 94 | 94 |
| 24 | Sandpiper Elementary | Belmont-Redwood Shores Elementary | Redwood City | 92 | 94 | 94 |
| 25 | Brittan Acres Elementary | San Carlos Elementary | San Carlos | 90 | 96 | 93 |
| 26 | Green Hills Elementary | Millbrae Elementary | Millbrae | 91 | 96 | 93 |
| 27 | Encinal Elementary | Menlo Park City Elementary | Atherton | 93 | 94 | 93 |
| 28 | Foster City Elementary | San Mateo-Foster City | Foster City | 90 | 96 | 93 |
| 29 | San Carlos Charter Learning Center | San Carlos Elementary | San Carlos | 93 | 88 | 92 |
| 30 | Brewer Island Elementary | San Mateo-Foster City | Foster City | 87 | 95 | 92 |
| 31 | Spring Valley Elementary | Millbrae Elementary | Millbrae | 88 | 92 | 90 |
| 32 | Roosevelt Elementary | Burlingame Elementary | Burlingame | 85 | 93 | 89 |
| 33 | Meadows Elementary | Millbrae Elementary | Millbrae | 90 | 91 | 88 |
| 34 | Beach Park Elementary | San Mateo-Foster City | Foster City | 86 | 96 | 88 |
| 35 | Heather Elementary | San Carlos Elementary | San Carlos | 85 | 90 | 88 |
| 36 | Washington Elementary | Burlingame Elementary | Burlingame | 85 | 89 | 88 |
| 37 | Farallone View Elementary | Cabrillo Unified | Montara | 85 | 85 | 87 |
| 38 | John Muir Elementary | San Bruno Park Elementary | San Bruno | 83 | 87 | 86 |
| 39 | Brisbane Elementary | Brisbane Elementary | Brisbane | 81 | 88 | 86 |
| 40 | Audubon Elementary | San Mateo-Foster City | Foster City | 79 | 91 | 85 |
| 41 | Parkside Montessori | San Mateo-Foster City | San Mateo | 86 | 81 | 85 |
| 42 | George Hall Elementary | San Mateo-Foster City | San Mateo | 83 | 86 | 85 |
| 43 | Marjorie H. Tobias Elementary | Jefferson Elementary | Daly City | 84 | 84 | 84 |
| 44 | McKinley Elementary | Burlingame Elementary | Burlingame | 80 | 86 | 84 |
| 45 | Roy Cloud Elementary | Redwood City Elementary | Redwood City | 83 | 83 | 83 |
| 46 | Buri Buri Elementary | South San Francisco Unified | South San Francisco | 82 | 84 | 83 |
| 47 | Nesbit Elementary | Belmont-Redwood Shores Elementary | Belmont | 84 | 77 | 80 |
| 48 | Vallemar Elementary | Pacifica | Pacifica | 75 | 82 | 80 |
| 49 | Portola Elementary | San Bruno Park Elementary | San Bruno | 77 | 78 | 79 |
| 50 | Highlands Elementary | San Mateo-Foster City | San Mateo | 75 | 81 | 79 |